GEODASY: Extended Laboratory System
A F Howland Associates has provided the geotechnical industry with specialist software since the 1980’s. Its flagship product GEODASY has been available as both DOS and Windows systems. Key to the success over this period has been the development of the software within a working geotechnical practice. The underlying principle for which GEODASY is renowned is ease of use. Indeed, after nearly 15 years, we still have customers who do not wish to upgrade from the DOS version.
As a separate development to the lab work module within GEODASY, we have been in the process of putting together a Lab System. This will provide a means of processing raw data from laboratory sheets efficiently and in a manner that is compatible with GEODASY.
The intention is to provide a system that will cover all the standard geotechnical laboratory tests. At present elements include;
- Import sample details from data created in GEODASY
- Natural Moisture Content
- Atterberg Limits / Linear shrinkage
- Particle Size Distribution
- pH and Sulphate/Chloride/Organic matter/ Loss on ignition
- Unconsolidated undrained Triaxial Compression
- Consolidated undrained Triaxial Compression
- Dry density/moisture content relationship
- California Bearing Ratio
- One-dimensional consolidation
- Point Load Index
- Moisture condition value (MCV)
- Saturated moisture content (SMC)
- Shear box
- Permeability
- AGS export facility
Access to a ‘reader’ that may be distributed to client organisations to allow data to be emailed and output in final form
Full management facility to allow editing, copying, renaming and back-up procedures
Transfer direct to GEODASY for manipulation and processing
However, we appreciate that commercial laboratories will have their own particular working practices and methods, regardless of the standards to which individual tests are undertaken. The sign of any good software is that it adapts to the way the user works, rather than for the user to need to adapt to it. On this basis, we offer a policy of amendment and modification to ensure that elements, such as entry screens, offer the maximum efficiency.
What follows is a brief description and representation of the manner of the present entry screens. The raw data is processed to calculate the necessary results. Where graphical representation is needed this can be pre-viewed at the point of data entry and the user given the means to adjust the curve in accordance with experience and judgement.
System entry screens
Sample Details
A test schedule is expected to have been supplied by the client or commissioning body. This allows the necessary sample details to be entered, together with the sample description (BS 1377 etc). Sample details can be transferred from separate copies of GEODASY to save duplication.
Natural moisture content
The details for batch samples can be entered and the natural moisture contents calculated.
The uniqueness of contract number and sample details means that the result can be utilised automatically for any test on that sample.
Atterberg Limits
Atterberg limit results are obtained from Plastic Limit and Liquid Limit calculations.
Together with the natural moisture content of a sample, the data can be presented in a tabulated form or by A-line representation
Particle Size Distribution
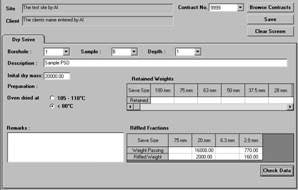 |
Particle size details are entered for wet and dry sieving and can be amalgamated with hydrometer and pipette details to provide composite grading curves. |
pH and Sulphate/Chloride/Organic matter/ Loss on ignition
pH and Sulphate/Chloride/Organic matter/ Loss on ignition data is entered on screens that adopt the same approach and allow the results to presented in simple tabulated form
Unconsolidated Undrained Triaxial Compression
Although the ability to link directly to data loggers has been established and proved, at this stage of development we have focussed on providing conventional manual data entry systems for triaxial compression tests.
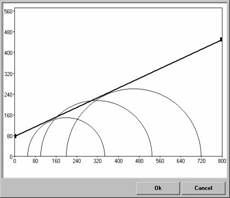 |
The entry procedure includes a procedure for displaying the Mohr circle, with a best-fit estimate of the Mohr envelope, which can be manually adjusted to allow for anomalous data points. |
Dry density/moisture content relationship
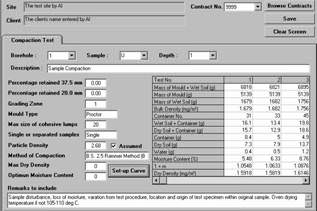 |
Dry density/moisture content details are first entered and then graphed to establish the optimum moisture content and maximum dry density. |
|
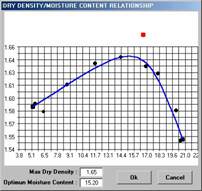
The compaction curve is pre-viewed to screen with a best-fit line generated by the system. A routine is included that allows the curve to be adjusted by the technician to account for anomalous data points. The curve is saved with the data, and output as part of the results.
|
California Bearing Ratio
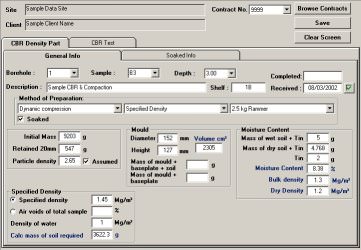 |
California Bearing Ratio data is entered and can be graphed and pre-viewed on screen so that the CBR values can be accepted before the data is stored. |
Point Load Index
The entry screen is laid out to allow batch processing of test data

|

